应用弹性伸缩
Here we will introduce how to use OBI to integrate with OBI metrics and HPA to scale application(pods).
Basic Concepts
Custom Metrics
The CPU or RAM consumption of an application may not correctly indicate the right metric for scaling. For example, if you have a message queue consumer which can handle 500 messages per second without crashing. Once a single instance of this consumer is handling close to 500 messages per second, you may want to scale the application to two instances so that load is distributed across two instances.
The metric-server aims to provides only the core metrics such as memory and CPU of pods and nodes. For all other metrics, you need to build the full metrics pipeline.
Aggregation Layer
One of the key pieces which enable exposing the metrics via the Kubernetes API layer is the aggregation layer. The aggregation layer allows installing additional APIs which are Kubernetes style into the cluster. This makes the API available like any Kubernetes resource API but the actual serving of the API can be done by an external service which could be a pod deployed into the cluster.
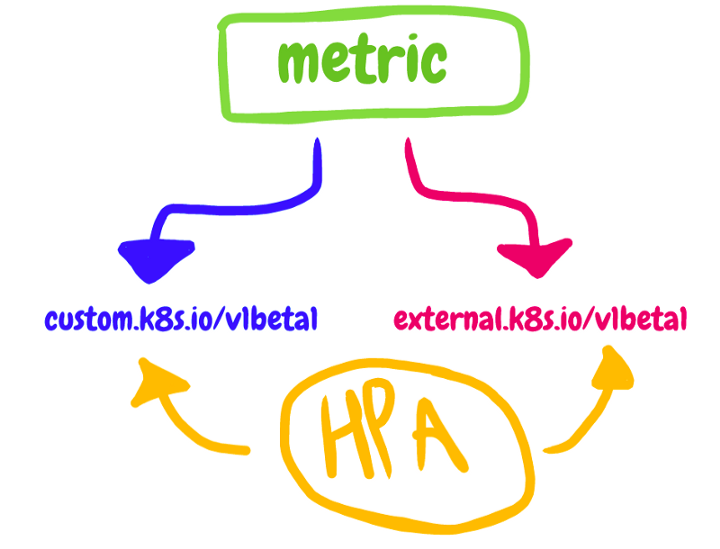
So we use custom metrics API and the external metrics API (for metrics that don't describe kubernetes objects) to create an OBI adapter.
Deploy and try the OBI adapter
- Deploy OBI metrics adapter by running the command below:
kubectl apply -f manifests/install/metrics-adapter/obi-adapter.yaml
It'll deploy the service to handle external metric, and create an APIService to let aggregation layer know it when need to invoke it.
apiVersion: apiregistration.k8s.io/v1
kind: APIService
metadata:
  name: v1beta1.external.metrics.k8s.io
spec:
  service:
    name: obi-metrics-adapter
    namespace: arbiter-system
  group: external.metrics.k8s.io
  version: v1beta1
  insecureSkipTLSVerify: true
  groupPriorityMinimum: 100
  versionPriority: 100
- Create a demo deployment for HPA test later.
We can use the sample: manifests/example/adapter/service-hpa-demo.yaml. It'll consume one CPU core using resource-consumer images.
kubectl apply -f manifests/example/adapter/service-hpa-demo.yaml
You can use 'kubectl top pod -n arbiter-system' to check the metrics, it should use around 1000m CPU cores.
- Create an OBI to collect the CPU of the deployment created above.
kubectl apply -f manifests/example/adapter/obi-cpu-metrics.yaml
# then check the OBI status to see if the data is collected
kubectl edit obi -n arbiter-system obi-cpu-metrics
- Then we can deploy a HPA object to use the external OBI.
- Create an HPA using external metric, take manifests/example/adapter/hpa-using-obi.yaml as an example
apiVersion: autoscaling/v2beta1
kind: HorizontalPodAutoscaler
metadata:
  name: hpa-using-obi-adapter
spec:
  scaleTargetRef:
    apiVersion: apps/v1
    kind: Deployment
    name: cpu-cost
  minReplicas: 1
  maxReplicas: 5
  metrics:
  - type: External
    external:
      metricName: obi-cpu-metrics
      metricSelector: {}
      targetAverageValue: 500m
For the scaleTargetRef, update to use your associated resource. And for metrics, here we're using External type and the metricName is the name of OBI, metricSelector is the label to match with the external metrics, targetValue is the target metrics value to scale.
- OBI、HPA and the resource from scaleTargetRef must be in the same namespace to let it work normally.
- Then you'll see the HPA will scale the deployment to 5 replicas after some time.
You can also describe or get the HPA to check the currentAverageValue or targetAverageValue.
Tips
- You can use kubectl to check the values from external metrics, it
kubectl get --raw "/apis/external.metrics.k8s.io/v1beta1/namespaces/arbiter-system/obi-cpu-metrics"
it should return data like below:
{"kind":"ExternalMetricValueList","apiVersion":"external.metrics.k8s.io/v1beta1","metadata":{},"items":[{"metricName":"obi-cpu-metrics","metricLabels":null,"timestamp":"2022-11-10T14:43:37Z","window":0,"value":"2007m"}]}